High-Resolution Digital Image Analysis for Assessing Fibrosis in NASH Models for Swiss Pharma

PROVEN INTELLIGENCE ACCELERATING NEXT-GENERATION THERAPIES

High-Resolution Digital Image Analysis for Assessing Fibrosis in NASH Models for Swiss Pharma

Quantitative Digital Pathology for NASH Fibrosis Assessment

CELL & GENE | RNA | BIOLOGICS

Frequently Asked Questions (FAQ)

Technical Question Franklin Biolabs Response
How does digital image analysis improve upon traditional semi-quantitative fibrosis scoring? Our platform replaces subjective, categorical scoring (e.g., METAVIR, Ishak) with continuous, quantitative data. By applying validated algorithms to whole-slide images, we measure the precise percentage of fibrotic area, collagen fiber thickness, and spatial distribution, eliminating inter-pathologist variability and increasing statistical power.
What specific stains and algorithms are used to quantify collagen deposition in NASH models? We primarily utilize Picro-Sirius Red (PSR) and Masson’s Trichrome stains. Our proprietary algorithms are trained to segment and quantify collagen-positive areas, calculating metrics such as Collagen Proportionate Area (CPA) and analyzing fiber morphology to provide a comprehensive, objective assessment of fibrosis progression or regression.
Can your platform differentiate between pericellular and bridging fibrosis? Yes. The algorithms are designed to perform spatial analysis, capable of distinguishing and quantifying different fibrosis patterns. We can measure the distribution of collagen around hepatocytes (pericellular) versus the formation of connections between portal tracts and central veins (bridging fibrosis), providing deeper insight into the stage of liver injury.
How do you ensure data reproducibility across different tissue sections and study cohorts? Reproducibility is maintained through a strict GxP framework. This includes standardized tissue processing and staining protocols, automated calibration of our high-resolution slide scanners, and the consistent application of locked-down analysis algorithms. All metadata and results are managed within a secure, auditable database.

A close-up, blue-toned image of scientific glassware, featuring vials placed in a dish filled with clear, spherical beads, suggesting a laboratory or research setting.

A scientist in a modern lab analyzes colorful DNA sequencing data on a tablet.

Executive Summary

High-resolution digital image analysis provides objective, quantifiable data on fibrosis, de-risking NASH therapeutic development by replacing subjective scoring with reproducible metrics. This approach generates continuous variable data, enhancing the sensitivity to detect subtle therapeutic effects and strengthening the data package for regulatory submission.

The Challenge of Subjectivity in Fibrosis Scoring

In non-alcoholic steatohepatitis (NASH) studies, traditional histology relies on semi-quantitative scoring systems to evaluate fibrosis. While established, these methods are inherently limited by pathologist subjectivity and can produce categorical data that may obscure subtle but significant treatment-induced changes in the extracellular matrix. This variability introduces risk into pivotal IND-enabling studies, where precise and reproducible endpoints are necessary.

A close-up of a multi-channel pipette dispensing liquid into a microplate in a laboratory setting, with a blue color overlay.

A close-up, detailed shot of a Sartorius Stedim Biotech BIOSTAT STR® single-use bioreactor in a laboratory setting.

Objective Quantification with High-Resolution Image Analysis

We circumvent these limitations by deploying automated, algorithm-driven digital pathology. This methodology transforms qualitative observations into precise, continuous data points.

  • Whole-Slide Imaging: Tissues are digitized at high resolution to capture the entire section for comprehensive analysis.

  • Algorithm-Based Segmentation: Validated algorithms identify and segment specific histological features, such as collagen fibers stained with Picro-Sirius Red.

  • Quantitative Metrics: The platform calculates key antifibrotic efficacy endpoints, including Collagen Proportionate Area (CPA), fiber length, and thickness.

This quantitative process provides the objective, granular data required for confident, data-driven development decisions.

Analytical Precision as a Cornerstone of Therapeutic Development

The requirement for analytical precision in pathology mirrors the challenges seen in vector engineering and characterization. For instance, the accurate amplification of AAV genomes from tissue requires high-fidelity tools to ensure the resulting data reflects the true biological state (PMID: 34448594). Similarly, our digital pathology platform acts as a high-fidelity tool to ensure efficacy measurements are an accurate reflection of therapeutic activity, not analytical noise.

Investigations into AAV vector genome structures have revealed significant molecular heterogeneity that can influence transduction efficiency (PMID: 20113166). This biological complexity underscores the need for analytical methods that can capture and quantify nuanced changes. Digital pathology provides this capability, detecting subtle shifts in fibrosis patterns that are missed by conventional scoring.

A scientist in a lab coat and gloves looks through a microscope in a laboratory setting, with a blue color overlay.

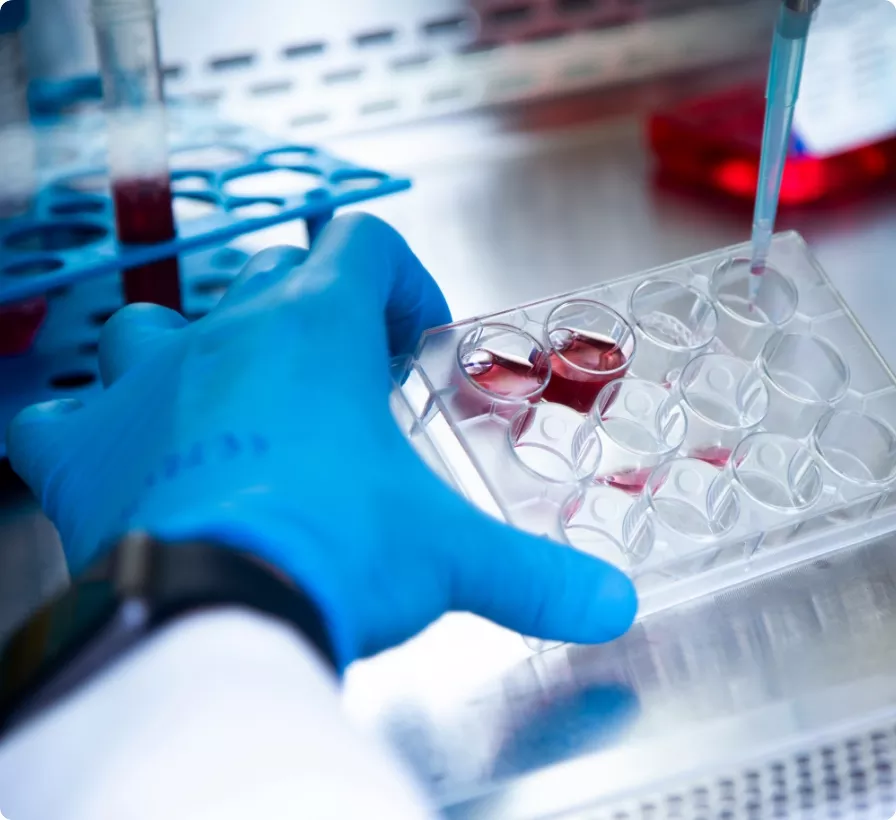
A scientist pipetting a red liquid into a multi-well plate in a laboratory setting.

GxP-Compliant Histology and Data Integrity

Our studies are conducted within a >100,000 sq ft facility operating under a unified GxP quality system. This ensures that all histology, imaging, and data analysis activities generate reliable and reproducible results suitable for regulatory review. This robust data foundation is integral to our typical 18-24 month IND timeline. Since 2019, programs managed under this quality system have achieved a 100% IND success rate (the Franklin Biolabs brand launched in 2024).

Commitment to Animal Welfare

All in vivo studies are performed in full compliance with our Animal Welfare framework, which incorporates the 3Rs: Reduction, Refinement, and Replacement. Our programs are overseen by AAALAC and USDA, ensuring the highest ethical standards are maintained throughout the research process.

Scientific Process Diagram

This content is for informational purposes. For guidance specific to your therapeutic program, please contact our team for a consultation.