MHRA Guidelines for T-Cell Immunogenicity Assessment using ELISpot for Allogeneic Cell Therapies

PROVEN INTELLIGENCE ACCELERATING NEXT-GENERATION THERAPIES

MHRA Guidelines for T-Cell Immunogenicity Assessment using ELISpot for Allogeneic Cell Therapies

MHRA-Compliant T-Cell Immunogenicity Assessment for Allogeneic Therapies

CELL & GENE | RNA | BIOLOGICS


  • De-risking Allogeneic Cell Therapy Development with Predictive T-Cell Response Analytics.*

For allogeneic cell therapy developers targeting UK and EU markets, navigating MHRA expectations for immunogenicity is a primary development hurdle. A robust T-cell immunogenicity assessment strategy is a core component of the safety and efficacy data package. The application of the Enzyme-Linked Immunospot (ELISpot) assay as the standard for quantifying T-cell responses provides the functional data required to de-risk clinical programmes and support successful regulatory submissions.

What is the recommended primary cell type for ELISpot assays under MHRA guidelines for allogeneic products?

Peripheral Blood Mononuclear Cells (PBMCs) are the standard. Proper collection, cryopreservation, and thawing protocols are foundational to ensure high cell viability and functional integrity, which directly impacts the quality of the resulting data for regulatory review.

How do you establish a validated positive cut-point for T-cell responses in an ELISpot assay?

A statistical approach is applied to a panel of naive, unexposed donor samples. The cut-point is typically defined as the mean response of the negative control wells plus a multiple (e.g., 2 or 3) of the standard deviation. This establishes a statistically significant threshold for identifying treatment-induced responses.

Can ELISpot differentiate between pre-existing and treatment-induced T-cell memory?

Yes, through strategic assay design. By comparing responses in pre-treatment and post-treatment samples and using an appropriate negative control population, we can distinguish between pre-existing immunity and a de novo response induced by the therapeutic product.

What sample volume and processing are required for a GxP-compliant ELISpot analysis?

Typically, a minimum of 20-30 mL of whole blood is required to isolate a sufficient number of PBMCs for a comprehensive analysis, including multiple stimuli and controls. All processing, from isolation to plating, is conducted within our GxP-compliant, >100,000 sq ft facility to ensure data integrity for regulatory submissions.

Regulatory Expectations for T-Cell Monitoring

Allogeneic cell therapies inherently carry the risk of host-versus-graft immune responses, which can compromise both safety and therapeutic durability. MHRA guidance places significant emphasis on prospectively monitoring for cell-mediated immunity. The objective is to identify and quantify any T-cell responses directed against the allogeneic product, as these are primary drivers of potential rejection and loss of efficacy. A failure to adequately characterize this response profile creates significant regulatory risk and can delay clinical progression.

A blue-toned image of white lab rats in their cages within a laboratory or vivarium setting, likely for scientific research or testing.

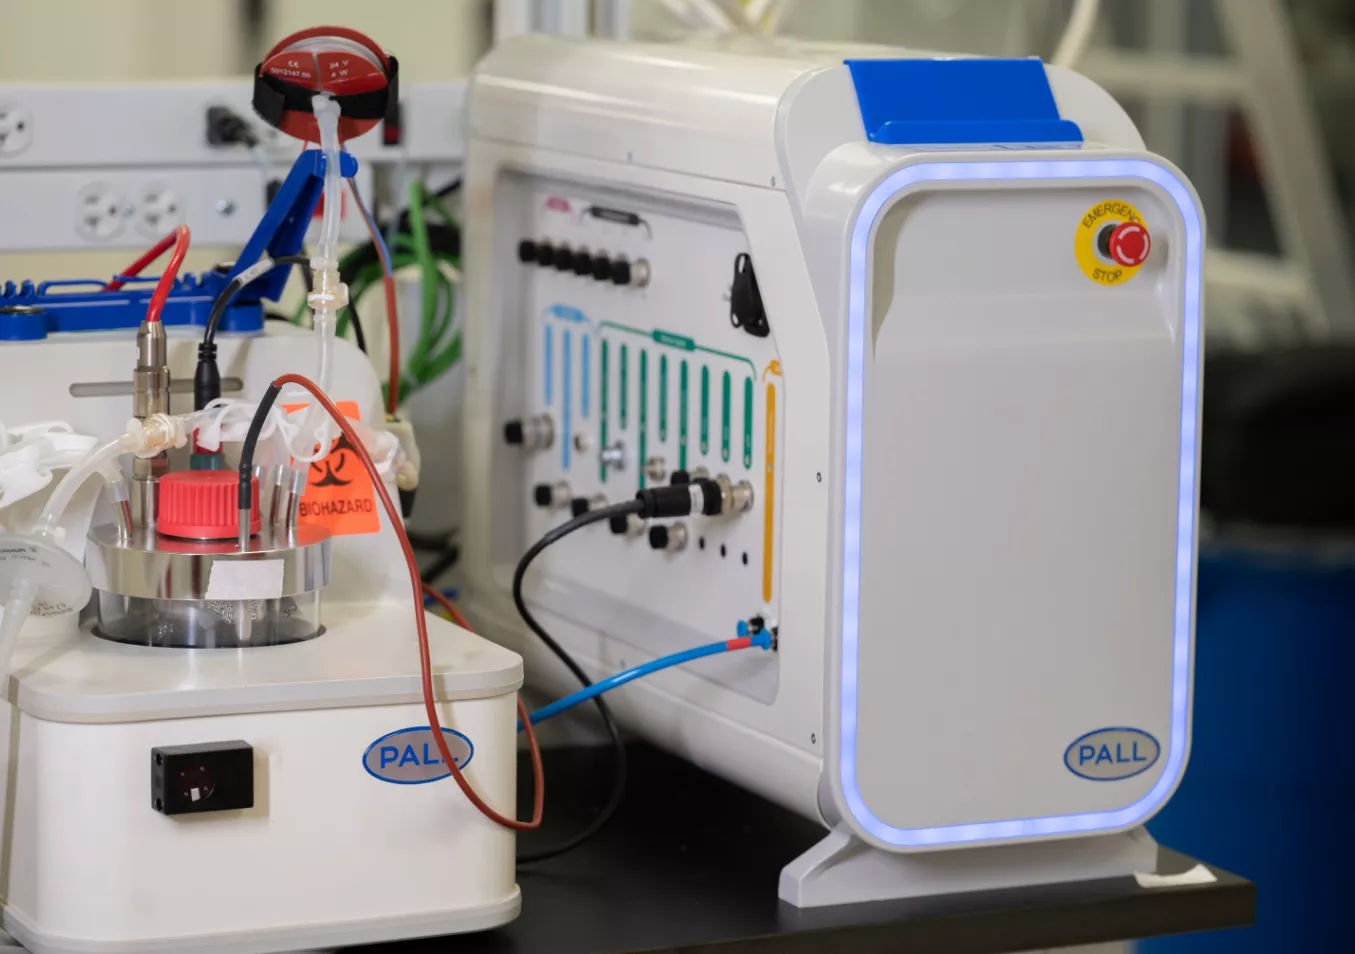
A close-up shot of a modern bioreactor system and control unit from Pall Corporation in a clean laboratory environment.

ELISpot: The Standard for Functional T-Cell Assessment

Functional assays that measure T-cell activity, such as cytokine secretion, are required for quantification. The ELISpot assay directly measures the frequency of cytokine-secreting T-cells at a single-cell resolution, providing highly sensitive and quantitative data.

  • Functional Readout: Detects the secretion of key cytokines like Interferon-gamma (IFN-γ), directly indicating a functional T-cell response.

  • High Sensitivity: Capable of detecting rare antigen-specific T-cells, often at frequencies as low as 1 in 100,000 PBMCs.

  • Quantitative Data: Provides a direct count of spot-forming units (SFUs), enabling clear statistical analysis and comparison between treatment groups and timepoints.

The principles of robust T-cell assessment are consistent across advanced modalities. As demonstrated in studies of host immunity to viral vectors, developing validated protocols to measure T-cell responses is a key component of a comprehensive immunogenicity evaluation for any complex biologic (PMID: 29668327). This focus on functional immunity provides the actionable data needed to interpret clinical outcomes.

Assay Selection: ELISpot in Context

While ELISpot is the standard for quantifying the frequency of responding T-cells, it is often complemented by other assays to provide a more complete picture of the immune response. Intracellular Cytokine Staining (ICS) followed by flow cytometry, for example, can provide phenotypic information about the responding cell populations.

Feature ELISpot Assay Intracellular Cytokine Staining (ICS) by Flow Cytometry
Primary Readout Frequency of cytokine-secreting cells (SFU/million cells) Percentage of cytokine-positive cells within a specific phenotype
Sensitivity Very high (detects ~1 in 100,000 cells) High (detects ~1 in 10,000 cells)
Functionality Directly measures active secretion at single-cell level Measures intracellular accumulation; requires protein transport inhibitors
Multiplexing Limited (1-3 cytokines per well, typically) High (10+ parameters, allows deep phenotyping)
Throughput High (amenable to 96-well plate format) Moderate (sample-by-sample acquisition)
Regulatory Context Well-established, often preferred for primary endpoint immunogenicity Complementary; provides phenotypic context for responding cells

A stylized 3D rendering of a DNA double helix, composed of light-colored spheres on a translucent blue backbone, set against a soft-focus, light blue background.

Integrating T-Cell Data into Your IND Programme

Our GxP-compliant ELISpot assays are designed to support programmes from preclinical development through clinical phases, helping sponsors achieve an average 18-24 month IND timeline. The data generated provides insights that inform dose selection, patient monitoring strategies, and overall risk assessment. This commitment to providing robust, submission-ready data is a core component of our Immunogenicity Intelligence for Advanced Therapies. Since the Franklin Biolabs brand launch in 2024, programmes leveraging our bioanalytical data have maintained a 100% IND success rate, a record established by our scientific teams since 2019.

Scientific Process Diagram

This content is for informational purposes. For guidance specific to your therapeutic program, please contact our team for a consultation.